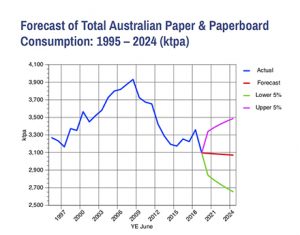
Australia’s total consumption of all paper and paperboard will decline a calculated 0.2% (around 5000 tonnes) per annum through to 2024, according to the latest headline forecasts*prepared by IndustryEdge. Sources: IndustryEdge, Timberbiz
In addition to the total consumption forecast, forecasts have been prepared for the two major grades.
The headline forecast for Printing & Communication papers suggests there will be demand growth of 0.1% per annum, but with a potential volatility of up to 80% of current consumption levels.
For Packaging & Industrial grades, the headline forecast is very different, suggesting a decline in 2019-20 of 5.1%, before annual increases of 0.5% per annum to 2024, with a volatility of only 19% of current consumption levels.
IndustryEdge cautions wariness in the adoption and use of forecasts. To understand more, read the note at the end of this item*.
The forecast of total consumption inevitably ‘washes out’ the very different forecasts for the major grades of paper and paperboard.
At 3096 kt in 2018-19, Australia’s consumption of paper and paperboard recorded its lowest total consumption since IndustryEdge began collating data series.
Over the period to mid 2024, the forecasts suggest consumption will decline a modest 0.2% per annum, falling around 5.0 kt per annum to 3,071 kt. This is a modest decline, but one that is by no means set in stone, as the 95% confidence intervals indicate. They show that consumption could be in a range of 13.5% above or below that forecast by 2024, totalling as little as 2,655 kt and as much as 3,486 kt.
* It should be noted that the total consumption forecast includes all grades of paper and paperboard, including Tissue, Newsprint, Printing & Communication and Packaging & Industrial paper but excluding all converted products.
The calculations are based on 25 years of prior consumption data, up to the year-ended June 2019. No external co-efficients were used.
The confidence intervals were set at 95%, meaning that in general, it can be expected the actual consumption has a 95% chance of falling between the Lower 5% and the Upper 5%. The February 2020 edition of PPE will contain forecasts for the New Zealand industry.
For more information visit www.industryedge.com.au


