The total number of housing loans fell in September – but for the usually stable owner-occupier loans, the falls were quite steep. Over the year-ended September 2018, the total number of loans to owner-occupiers was 2.8% lower than the prior year. However, the average size of loans grew from September 2017 to September 2018, with growth recorded every month until September itself. Source: IndustryEdge for Timberbiz
In September, the average size of loans fell between 1.2% and 2.7%, compared with August. Large falls by any measure, the declining size of loans means the average price of houses also fell over the month. Sharply.
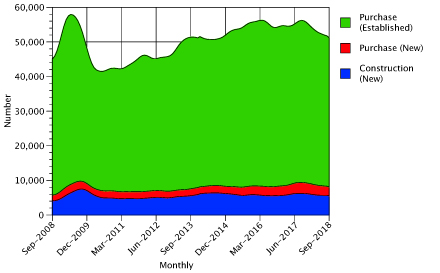
In this data, we can see the total number of loans each month, broken down by the purpose of the loan. This is shown, on a monthly basis for the last decade in Figure A, and does not include loans for alterations and additions, and only for owner-occupiers. It thus removes the sometimes noisy debate surrounding the role of investors in the housing market.
In total, over the year-ended September, the number of loans declined 2.8% compared with the prior year, totalling just short of 641,000 loans.
Fig. A: Housing Loans by Type: Sep ’08 – Sep ’18 (Number)

Source: ABS
The table below presents the number of loans issued for each of the last two years. It shows that the number of loans for new dwellings increased over the year-ended August, but that loans for established properties declined by 3.1% or 17,429 loans. Regardless, loans to purchase established properties accounted for almost 84% of total loans over the year.
Housing Loans by Type: YE Sep ‘17 – YE Sep ’18 (Number & %)

Source: ABS
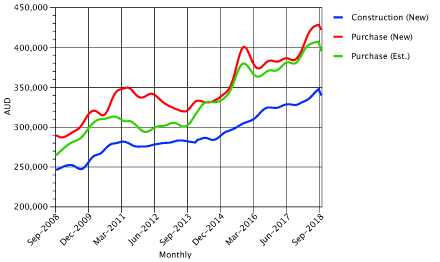
It will be of interest to see how the average value of different loans has behaved over the last decade. Figure B shows this and demonstrates that over all periods, the average size of loans for construction of new dwellings has grown more slowly than for the other loan types.
Fig. B: Average Housing Loan Value by Type: Sep ’08 – Sep ’18 (AUD)

Source: ABS
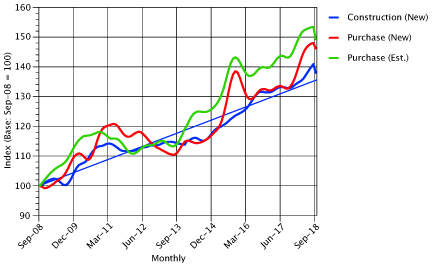
Figure C shows the same data, by type, on an index basis, over the last decade. We find this chart a little more helpful in understanding the loan value cycles that have been in operation. There are several cycles observable in the chart.
Fig. C: Average Housing Loan Value by Type: Sep ’08 – Sep ’18 (INDEX: Base Sep ‘08 =100)

Source: ABS
The most recent cycle appears to demonstrate that all three of the loan types have experienced growth in loan size that has been greater than the long-term trend of the lowest value loan type (for Construction of New dwellings) since early 2016.
However, for the Purchase of new dwellings (someone else built it) and especially for Purchase of established dwellings (someone else has lived in it), the upward price cycle was significantly longer.
The trends suggest that by late 2017, average prices for each loan type might have been expected to turn down, toward the trend line. Prices for Construction of new dwellings might even have been expected to dip below the trend line.
But that didn’t occur.
In fact, after looking like it would occur, (though not for Purchase of established dwellings) the average loan size for each dwelling actually rose over the period through to August 2018, but turned down aggressively in September 2018, as the charts show.
The table below shows the average value of loans of each type in August 2017 compared with August 2018.
Average Value of Dwelling Loans by Type: Sep ‘17 – Sep ’18 (AUD & %)

Source: ABS
Over the last year, the average value of a loan for construction of a new dwelling rose 3.9%, while the average value of loan to purchase a new home (say, from a developer), rose 10.1% and was significantly larger than if you had built the home yourself. Buying an existing house, already lived in by someone else, saw average loan sizes grow 4.3%.
But, and this is probably the telling point, and as the chart clearly shows, the average value of loans slumped in September, as the detail below shows:
Construction (New) -2.1%
Purchase (New) -1.2%
Purchase (Established) -2.7%
These simple average loan values can include the influence of a wide variety of factors such as Government financial support for new home buyers, packages for purchases from developers that include extras that go on the loan for purchase of new dwellings, but not on the other types, and so on. Still, the declines are clear, significant and commentators expect lower loan values to continue.
Paradoxically, lower average loan values mean improved housing affordability, but also mean some existing home owners – especially those who got in at the top of the market – are going to face a different form of mortgage stress.
As Australia grapples with questions of housing affordability, it is relevant to consider loans and loan sizes, along with the related issues of household indebtedness and the pace of wages growth. Looking ahead, the housing market really is not for the faint-hearted.
Every month, IndustryEdge publishes Wood Market Edge, Australia’s only forestry and wood products market and trade analysis, and supplies its customers with hundreds of unique data products, advisory and consulting services.
Find out more at www.industryedge.com.au


