Parsing some of the data and language associated with the global wood pellet trade can be a daunting task. While poking around for current wood pellet industry data recently, I found some interesting information on the US Energy Information Administration’s (EIA) website called the “Monthly Densified Biomass Fuel Report.” That was the first indication that my terminology was not up to date.
Looking into the meaning behind “densified biomass,” the term includes compressed pellets, bricks, briquettes and other units of organic material not only derived from wood but also from grass, rice hulls, shells and other agricultural residues as well. Here in the US, however, the vast majority of densified biomass comes in the form of wood pellets.
Based on the most recent EIA information, which was updated in March 2020, I was able to produce the following table that provides a look at the current state of the industry.
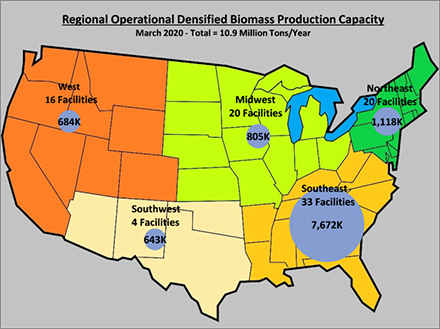
The EIA information indicates there are 102 densified biomass facilities, 93 of which are currently in production with a total capacity of almost 11 million tons of product per year. Using a rough 2-to-1 factor, I calculated that would equate to about 22 million tons of green raw material.
Since EIA also provides location information by region and state, I did a deeper dive and looked a little more closely at the data. Since the forest industry tends to refer to five distinct US regions, I reconfigured the information for the facilities currently in operation.
WoodWood pellet production and utilization really got off the ground back in ‘70s in the northeast—initially as a response to the oil crisis. But given the surge in overseas demand and the 10-year trend in industrial pellet facility development, it is not surprising that the US South is the dominant production region, but I was still impressed by the differentials.
When you put the data on a map, it really tells an interesting story.
Of course, the production increase in the southeast is tied to the demand from the UK and other European countries for renewable energy as they transition away for coal. The EIA history on biomass energy exports goes back to 2001 and runs through the end of 2019, but (wouldn’t you know it?) the units are in BTUs. And the numbers are really large – quadrillions!
Here we go again… more forest industry unit confusion.
(When I started in the wood industry in the 1970s, cords were still being used as a unit of measurement before the transition to weight took effect.
I made that transition and began thinking in tons before I took a detour to Brazil for a few years and adjusted to metric tons and the metric system in general. After returning to the US, I transitioned back to short tons and other English units of measure.)
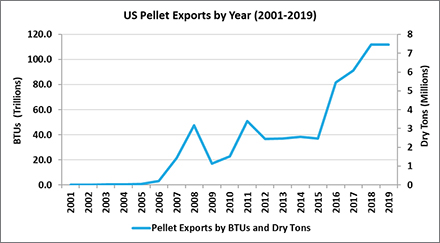
Looking deeper at the EIA data, I wanted to graph the trendline for biomass energy exports from wood pellets. Initially, most of the biomass energy exports were from wood but that changed over time with only about half of the exports in 2019 being derived from wood.
The following chart shows the wood component of total biomass exports in BTUs and, since most of that is in the form of wood pellets, the BTUs were converted to dry tons using a factor of 16.4 million BTUs per ton of pellets (which is represented on the secondary vertical axis.)
Now, the visual data is at least partially helpful to me. Pellet exports started to take-off in 2005-2006, but then really jumped post-2015 with over 7.5 million tons, or about 112 quadrillion BTUs, being exported in 2019. With numbers that large, I still had a hard time visualizing an actual quantity million tons, or about 112 quadrillion BTUs, being exported in 2019.
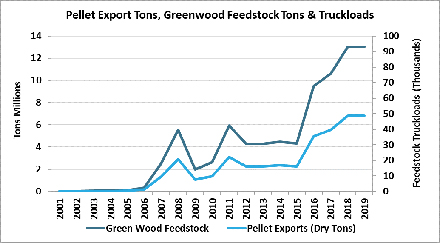
With numbers that large, I still had a hard time visualizing an actual quantity and what it represents in the form of green wood raw material.
To add even more context, I made another chart depicting both dry tons of pellets and green wood feedstock tons; the conversion factor used to calculate green tons was 8.6 million BTUs per ton. The following chart is the result and, since I still seem to visualize raw wood volumes better in terms of truckloads, a secondary vertical axis was included showing truckloads based on using a 25 ton-per-load conversion factor.
While the dry tons of pellets are the same as on the previous chart, we can now also see that it represents around 13 million tons of green wood material, or for those foresters like myself, over 90,000 truckloads of material. Which begged the obvious question: Just how much energy is produced using wood?
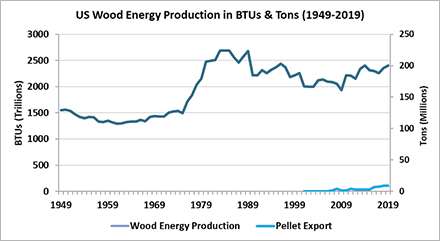
EIA also has some interesting historical data on US wood energy production from 1949 through 2019. However, unlike exports, the majority is likely not from pellets but from a variety of wood material sources. With that understanding, I picked a conversion factor of 12 million BTU per ton, which represents a blend of materials with around 30% moisture content. With this, I depicted the US wood energy production trendline in both BTUs and tons and then added the pellet export trendline to the chart just to add some perspective.
Last year, wood energy production in the US was over 2.4 quadrillion BTUs derived from roughly 200 million tons of wood. While the pellet exports are visible, they are a small but growing component of wood energy production.
One thing this chart really illustrates is that wood-consuming industries have done a good job of utilizing almost all the raw material procured from their operations. I am old enough to remember when sawmills had what they called “teepee burners” that were used just to get rid of the sawdust and bark.
That practice is long gone now (note the large uptick in wood energy production starting in the wake of the oil crisis in the mid-70s), and that material is either turned into other useful products (bark, mulch, etc.), or burned in boilers to produce heat and energy for their facilities or to supplement other utilities.
Obviously, the sawmill and pulp & paper industries produce and utilize much of this wood energy, but it does have a significant impact on overall energy production and use. Wood energy, whether in densified form or not, still plays an important role as a renewable feedstock in energy production in the US and around the globe.
Jay Engle is a Procurement Manager at Smith Creek Inc and has a Bachelor of Science in Forest Management from Purdue University US. She is frequent contributor to Forest2Market. This article was first published in Forest2Market.


